Author: admin

  • Feature Lifecycle in Architecture

    #feature #lifecycle #tracing

    When changing your application landscape on a bigger scale you might have to worry about a target architecture that you can only reach with intermediate steps like per year or release. Even a high-level roadmap may be rather complex due to necessary plan changes. The following reduced example shows the core problem:

    Feature Roadmap

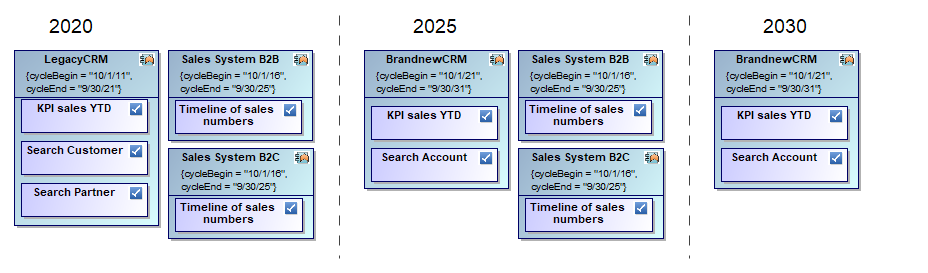
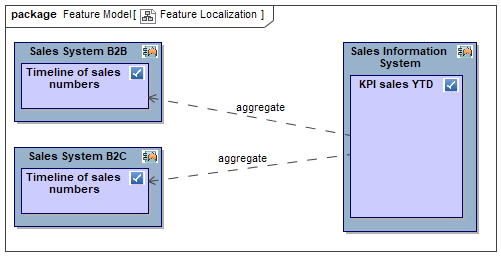
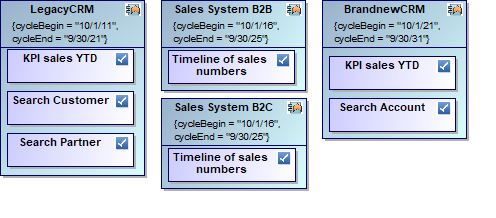
    As you see, applications are repeated in different time windows and so are the features they provide. Moreover, feature provisioning may change like “Duplicate Check” might move from “LegacyCRM” to “BrandnewCMR”. In addition, features themselves may change like “Search Customer” and “Search Partner” being merged into “Search Account”.

    I see people doing these things in Excel and Visio or, even worse, in Powerpoint. And everytime my hair stands up expecting a lot of waste or worse like lost COVID-19 results. Excel is a powerful thing, no doubt, but it has its limits. The right way to do such an exercise is using a proper method with a proper tool set. There are many options like application lifecycle tools, enterprise architecture management tools, and modeling tools. I will explain the core concept using a modeling tool, but it can easily be translated to other tools.

    The core concept is based on adding the notion of lifecycle or time in general to your plan elements. Each gets a begin and end date between which it is valid. Consequently, showing an application being valid from 2018 to 2022 in a plan scenario for 2025 is not valid because it is long gone. But, since applications and also features typically live for many years, we can save a lot of redundancy by reusing the same elements wherever valid which also drastically improves consistency of your plan.

    Now, you can understand much better how we build the diagram from above. In fact, our database contains less elements and relations than you count on the diagram since we simply reuse them where valid.

    Plan Elements

    You may already guess the drastic improvement you can achieve in your very probably much larger scenario. It’s getting even better because we are now able to improve data quality with data validation as well as Powerpoint slides and Excel sheets by simply getting those as results of reports. We can even transfer plan data from and to other tools if necessary like for requirements management or budget planning.

  • The Power of Feature Models

    #feature #modeling #tracing #portfolio

    In the following, we will have a look where feature models can help improving management of software development.

    Example for mapping features to apps

    Definition

    In software development, a feature model is a compact representation of all the products of the Software Product Line (SPL) in terms of “features”.

    source: Wikipedia

    There are many more sources on the subject, but this simple one will suffice here.

    Manage Development using Feature Models

    In software development features are mostly implemented by code. Your development process like e.g. Scrum typically focuses on people, communication, self-organizing teams, and a running system among other things. A Scrum team sprints its own way from stories to running code. A typical question popping up looking at the big picture is:

    “How can development be managed across teams and products?”

    Cascaded agile working models like SAFe and LeSS (Scrum of Scrums) argue that architecture plays an important role and at the same time needs to be aligned with the code. How can you scale architecture from product code to product portfolio?

    Scaling Architecture from Products to Portfolio

    Imagine you need to report a KPI for sales YTD based on weekly and daily sales data from various sales apps having different sales models. Three different app teams might be involved probably using different technologies and documentation. How do we get to a common denominator helping to organize development?

    First, let’s understand the business logic regardless of technologies. The feature “KPI sales YTD” itself is agnostic of sources delivering the raw data. It provides a unified concept into which some magic transforms the feature “Timeline of sales numbers” from sources B2C and B2B.

    Having identified those features we can now organize development. The app “Sales Information System” is responsible for calculating the KPI sales YTD while the apps “Sales System B2C” and “Sales System B2B” each manage timelines of sales numbers. Development effort can now be partitioned for the teams and dependencies are known too.

    The central idea here is to find a common concept for both products and portfolio. For those managing across products and teams features are used as basic units while app teams refine those to their specific needs.

    If you need more precision e.g. in the case that the aggregation of the timelines needs to be done in several steps like export timeline, enrich timeline, and sum up timeline you can cascade features. There are good approaches refining a feature model using e.g. business functions or business data or a combination of both.

    Conclusion

    Breaking products down into features has a lot of benefits

    • Speak a common language (portfolio and products)
    • Avoid double work (deduplicate feature implementation)
    • Avoid overall waste (streamlined feature catalogue)
    • Make progress transparent (plan per feature)
    • Ease analysis (impact per feature)
    • Clearly specify changes (story per feature change)

    Feature models support improvement of software development especially in case of self-organizing product teams.

  • Service for You: Architecture Potential Analysis

    #architecture #clarity #velocity #direction 

    I will find out for you, what potential is hidden in your IT – on enterprise level, project level, and system level.

    • Easily see where your processes sluggishly overlap based on consistent as-is tabular and graphical data
    • Gain grip with stronger planning capabilities
    • Drive things forward with clarity, velocity, and direction
    • Replace verbose talking and shiny bubbles with clear facts, a common target, and the ability to deliver

    High quality. Fully independent. Absolutely loyal.

    Fixed price option.

  • Executive Summary: Data Strategy 2.0

    #architecture #clarity #velocity #direction 

    In my last post Executive Summary: Strategic Data Science, I have summarized what Data Science is and what it consist of. Moreover, you need to deploy a strategy that helps you manage transformation to a data-driven business.

    Today, you will see that a strategy for data science can be handled just like any data strategy. And if you already have a data strategy deployed, e.g. as part of your governance or architecture initiative, then you will see why and where it is affected.

    As written in Executive Summary on EA Maturity, having a map knowing where you are and where you want to go to helps a lot in finding a way.

    Maturity

    If you are working with maturity models, you typically do this on a yearly basis. For chosen capabilities you identify current vs target maturity e.g. ranked from level 1 to 5.

    The first thing you need to understand is that introducing data science for the first time reduces your overall maturity at once. Why is that?

    Maturity is measured in terms of capabilities. And if you take a look into those capabilities you will find that you need to adapt them. There typically are a dozen or so like vision, objectives, people, processes, policies, master data management, business intelligence, big data analytics, data quality, data modeling, data asset planning, data integration, and metadata management.

    I will pick only a few as examples to make things clear. Let’s pick vision, people, and technology.

    Selected Capabilities for Explaining Maturity of Data Strategy

    Vision

    Say you have a vision like: “Providing customer care that is so satisfying, that every customer comes back to us with a smile”. That’s a very strong statement, but how about: “Keeping every customer satisfied by solving all problems before complaining”. Wow, even stronger. It is possible because Data Science allows you to predict what others can’t.

    People

    Probably, you already have a data architect. But, the classic data architect focuses on architecture, technology, and governance issues. This is OK, but you also need some data advisor focusing on unseen solutions for the business. Someone telling you to combine customer data with product usage data increasing your sales. And perhaps even telling you from which of your precious data you can create completely new data-driven products you can sell.

    Technology

    Probably, you also have an inventory telling you which data sources are used in your applications. Adding Data Science as rapidly growing discipline to the equation, you may find that you will have to revise your technology portfolio. It is rapidly growing and changing and, therefore, needs to be governed to a certain amount (freedom vs standardization).

    Following list shows selected technologies that are most often used in Data Science (ranked from left to right).

    • Programming Languages: SQL, Python, R
    • Relational Databases: MySQL, MS SQL Server, PostgreSQL
    • Big data platforms: Spark, Hive, MongoDB
    • Spreadsheets, BI, Reporting: Excel, Power BI, QlikView

    Moreover, there is a shift in who is actually using these technologies like Leadership, Finance, Sales, and Marketing. And more often without dedicated enterprise applications because data analysis is very dynamic and has a lot of try and error to it.

    Conclusion

    From these view capabilities out of a dozen+ it has become clear that Data Science Strategy easily fits into an overall Data Strategy. There is no need to reinvent the wheel. Instead, adapt your existing or favorite Data Strategy to incorparate Data Science.

  • Model-Driven Test Generation with VelociRator

    #modeling #testing #generation #integration

    (excerpt in German available as part of article on Lean Quality Management in German Testing Magazin)

    Abstract

    Concept, code, and tests tend to drift apart in larger or longer running projects. A lot of time and money is wasted to keep them aligned and yet to a bad degree. With agile working models and higher frequency of deployment cycles this gets even worse.

    Two main reasons are identified:

    1. hands-on working style with insufficiently connected tools
    2. missing refactoring capability for concepts and tests (compared to code where we have learned to love powerful IDEs)

    In order to keep concept and code aligned I have presented model-driven system documentation in 2018, see Ni2018 in Publications.

    Today I will present model-driven test generation extending that successful alignment even further.

    After having motivated model-driven test generation, I will present a little journey that many of us work with, probably on a daily basis. I will start with an epic, manually created by some Product Owner in a well known tracking tool named Jira. Via interface this epic is pushed to a system model in MagicDraw. There, a business analyst describes the impact of the epic on already existing use cases. Then, VelociRator, the model-driven test generator, produces tests from modeled behavior. These tests are finally pushed back to Jira and linked to the initial epic closing the loop with a neat test coverage on the epic. 

    An outlook on model-driven test generation for automation will give a hint on how to combine test generation and test automation. Finally, I will conclude with why model-driven test generation saved our back during COVID-19.

    How does it work?

    The following figure shows the journey in phases around involved tools in the middle.

    Now, let’s repeat the quick journey taken above with a more detail.

    Define

    As PO I create a new issue like an epic in Jira. Let’s name it “Improve CDM and Lead Management”.

    Example epic

    Initially, the test coverage is empty. After assigning the issue to the team or some analyst of a team, the epic is pulled into a model.

    Analyse

    The model is our digital twin of the system under design. It contains system use cases describing the logical interaction of users with the system for a set of scenarios.

    Impact analysis, minimal version

    The analyst identifies which of our use cases are impacted by the new requirement by drawing dependencies from the use cases to the issue.

    Optionally, it is also possible to use change elements documenting what has to be changed and why.

    Design

    Next step is to dive into impacted use cases and change these accordingly.

    Example for a workflow given by an activity diagram

    The designer checks the steps in the workflow with associated rules, documentation, and expected results. Since testers, designers, and developers do their work based on those workflows, all relevant information is documented here. To the upper left we have highlighted a few steps so that we can easily find them in generated tests lateron.

    In addition, but not technically necessary, it is also possible to document the external view as some kind of micro architecture per use case.

    Example for external view – use case architecture

    Configure Tests

    Next, the tester configures the tests inside the model by providing values to test parameters of selected test paths.

    Example test configurations

    Each row is a test configuration and has name and documentation. All other columns represent test parameters like Account, CustomerType, and so on. When the test generator is switched on, it picks each selected test path and generates a test for each row.

    Test

    Back in Jira, the tester selects a generated test like the following.

    Example for test in Jira, extract, details omitted

    The name of the test is constructed from the name of the use case, the chosen alternative (ALT no fit), and the selected test configuration (person1). As part of its description you get a compact use case scenario. You also get full test details including test data and expected results per step.

    Closing the Loop

    Since the generated tests can be automatically linked to the originating epic, you also get a predefined test coverage.

    Example for test coverage

    If the tester now chooses to execute one or all of the tests, their results will be immediately reflected in the test coverage. Therefore, the PO can easily follow progress, too.

    Presentation

    See presentation below