Tag: architecture

  • Executive Summary: Application Lifecycle in EAM

    #architecture #clarity #velocity #direction

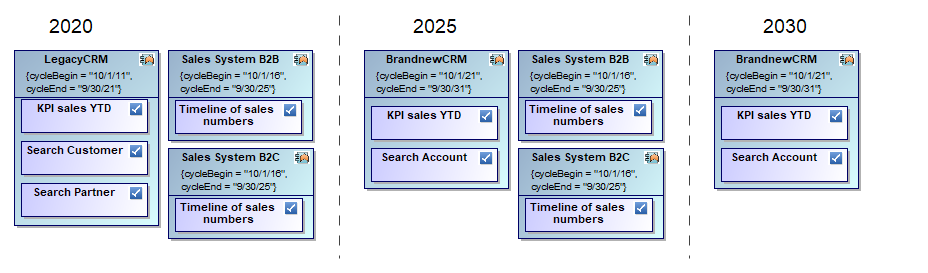
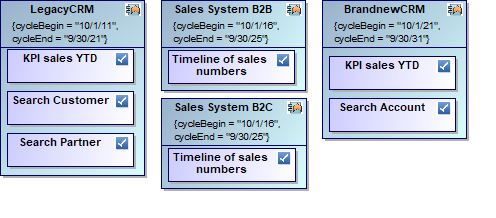
    Das Application Lifecycle Management (ALM) in LeanIX ist ein zentraler Bestandteil des Enterprise Architecture Managements (EAM). Es ermöglicht Unternehmen, den gesamten Lebenszyklus ihrer Anwendungen effektiv zu verwalten und zu optimieren. Dieser Prozess umfasst alle Phasen von der Planung und Entwicklung über den Betrieb bis hin zur Ablösung von Applikationen.

    LeanIX bietet als EAM-Tool umfangreiche Funktionen, um Application Owner bei der Verwaltung ihrer Anwendungen zu unterstützen. Es ermöglicht eine ganzheitliche Sicht auf die IT-Landschaft und hilft dabei, Abhängigkeiten, Risiken und Optimierungspotenziale zu identifizieren.

    In diesem Blog werden wir zunächst die Bedeutung des ALM für Application Owner erläutern und anschließend konkrete Verbesserungsvorschläge für die Umsetzung in LeanIX präsentieren. Ziel ist es, die Effizienz und Effektivität des Application Lifecycle Managements zu steigern und somit einen größeren Mehrwert für das Unternehmen zu schaffen.

    Sensibilisierung der Application Owner

    Um Application Owner, die mehrere Applikationen verantworten und der Meinung sind, dass sie LeanIX nicht benötigen, von der Wichtigkeit von EAM im allgemeines und des Tools im besonderen zu überzeugen, können folgende Testfragen mit Fokus auf Architektur, Prozesse und Daten gestellt werden:

    a) Architektur-bezogene Fragen:

    • Wie schnell können Sie herausfinden, welche Ihrer Applikationen von einer geplanten Infrastrukturänderung betroffen wären?
    • Welche Ihrer Applikationen nutzen veraltete Technologien und müssen in naher Zukunft modernisiert werden?

    b) Prozess-bezogene Fragen:

    • Wie würden Sie den Einfluss einer Ihrer Applikationen auf die gesamte Wertschöpfungskette des Unternehmens beschreiben?
    • Bei einem Ausfall einer Ihrer Applikationen: Wie schnell können Sie alle betroffenen Geschäftsprozesse identifizieren?

    c) Daten-bezogene Fragen:

    • Können Sie für jede Ihrer Applikationen die verarbeiteten Datenentitäten und deren Datenflüsse skizzieren?
    • Können Sie ad hoc angeben, welche Ihrer Applikationen personenbezogene Daten verarbeiten und wie diese geschützt werden?

    d) Übergreifende Fragen:

    • Wie schnell können Sie bei einer Audit-Anfrage alle relevanten Informationen zu Ihren Applikationen zusammenstellen?
    • Wie stellen Sie sicher, dass alle Stakeholder stets über den aktuellen Stand und geplante Änderungen Ihrer Applikationen informiert sind?

    Verbesserungsvorschläge für Application Lifecycle Management in LeanIX

    Um Application Owner bei der Pflege ihrer Applikationen in LeanIX zu unterstützen, die Unternehmensarchitektur stärker am Business auszurichten und den Zusammenhang zum Datenmanagement zu nutzen, schlage ich folgende konkrete Aktivitäten als Diskussionsgrundlage vor:

    1. Schulungen und Workshops für Application Owner:
      • Organisieren Sie regelmäßige Schulungen zu LeanIX und Best Practices
      • Führen Sie Workshops durch, die den Zusammenhang zwischen Applikationen, Geschäftsprozessen und Daten verdeutlichen
      • Erstellen Sie praxisnahe Leitfäden und Checklisten für die Pflege von Applikationen in LeanIX in einem leicht zugänglichen Werkzeug wie z. B. Confluence
      • Erstellen Sie LeanIX-Surveys, über die Application Owner relevante Informationen einfach durch Beantwortung zugeschnittener Fragenkataloge vornehmen können
    2. Prozessorientierte Modellierung in LeanIX:
      • Implementieren Sie eine prozessorientierte Sicht in LeanIX
      • Verknüpfen Sie Applikationen mit den unterstützten Geschäftsprozessen
      • Visualisieren Sie den Beitrag jeder Applikation zur Wertschöpfungskette
    3. Integration von Datenmanagement-Aspekten:
      • Erweitern Sie das LeanIX-Metamodell um relevante Datenmanagement-Attribute
      • Verknüpfen Sie Applikationen mit den von ihnen verarbeiteten Datenentitäten
      • Implementieren Sie Datenflussdiagramme, die den Zusammenhang zwischen Applikationen und Daten zeigen
    4. Automatisierung und Integration:
      • Implementieren Sie Schnittstellen zwischen LeanIX und anderen relevanten Tools (z.B. BPM, Data Management Platform)
      • Automatisieren Sie die Aktualisierung von Basis-Informationen in LeanIX
      • Erstellen Sie Dashboards, die den Pflegestatus und die Datenqualität visualisieren
    5. Governance und Anreize:
      • Etablieren Sie klare Verantwortlichkeiten und SLAs für die Pflege von Applikationsinformationen
      • Implementieren Sie ein Belohnungssystem für Application Owner, die ihre Daten aktuell halten
      • Führen Sie regelmäßige Reviews der Applikationslandschaft durch
    6. Daten-Governance Integration:
      • Verknüpfen Sie Daten-Governance-Rollen (z.B. Data Owner, Data Steward) mit den entsprechenden Applikationen in LeanIX
      • Implementieren Sie Attribute für Datenklassifizierung und Datenschutzanforderungen bei Applikationen
      • Erstellen Sie Reports, die Daten-Governance-Aspekte über die gesamte Applikationslandschaft hinweg zeigen
    7. Kontinuierliche Verbesserung:
      • Etablieren Sie einen regelmäßigen Feedback-Prozess mit Application Ownern
      • Analysieren Sie Nutzungsmuster in LeanIX, um Verbesserungspotenziale zu identifizieren
      • Passen Sie das Metamodell und die Prozesse basierend auf dem Feedback kontinuierlich an
  • Tool Styles for Architecture

    #architecture #clarity #velocity #direction #enterprise #modeling

    When doing enterprise architecture as well as systems engineering (or system architecture in detail) the question arises if there can be one meta model like Archimate and one tool that does it all.

    That means, supporting the strategic portfolio level (comparable to city planning) as well as the development-oriented system level (architecture for one building at a time).

    Roles vs Tool Styles

    A very important requirement if talking about ‘enterprise’ is easy access to the captured landscape and its building blocks if for business products, applications, data, or technology as well as blueprints, planned architectures, and governance. This access must be provided for a range of users comprised by many people in the enterprise very probably having various roles and skills.

    Since all this architectural information shall not only be consumed but also improved and maintained in a distributed fashion, it becomes clear that a tool focusing on diagram-first modeling style cannot be the answer no matter if based on UML, SysML, Archimate, or any other formal modeling language. The reason is that most of the users are not able to model and only a fraction can be taught due to the costs. Mostly, the focus lies on roles already having a certain skill set you can easily build upon, i.e., mostly roles matching the word ‘architect’. Prominent examples of such expert tools are MagicDraw (Cameo) by No Magic (now Dassault Systèmes), ARIS Architect by Software AG, Adonis by BOC, Innovator by MID, Enterprise Architect by Sparx, and others. But, as we will see, any of these can be part of your overall story.

    Since the average user needs a tool that makes live easier and not harder, most EA tool vendors have focused on an approach that is data-first ERP style – typically providing web-based access to collected portfolio information (products, applications, business objects, technologies, and such). That information is presented as profiles or sheets like for each application which can also be updated via data forms. Tools like Alfabet (planningIT) by Software AG, LeanIX by LeanIX, LUY by iteratec, ADOIT by BOC, and others follow this path. From the captured data, they automatically produce dynamic graphical or tabular reports. Some of these tools also support Archimate ranging from basic import over addition to their own metamodels to own metamodels based on Archimate.

    But why do EA tools always provide more than Archimate provides? This is because many important aspects in daily life are missing in Archimate like roles and permissions, multi-tenancy, life cycle information (planned, active, deactivated; generally state per date interval), portfolio planning capabilities (as-is, plan, to-be; the later with alternatives), tool integration features (requirements, publication, test management), and a lot more.

    Scaled Architecture

    On the other hand, the last decade has shown, that focusing only on the strategic portfolio level ignoring the reality on the ground easily leads to the ivory-tower syndrome producing badly accepted plans to change the IT landscape.

    In order to avoid this, it is important to couple portfolio data with refined software and hardware architectures. The portfolio acts as the common structure and its content had better reflect the software and hardware inside (compare with reporting). And that’s where the above mentioned architects come into play again. They can bridge this gap by drilling down deeper to system architecture level and even further.

    In that case, diagram-first modeling style tools for experts are more appropriate. As mentioned above, these are typically based on UML, SysML, Archimate, another modeling language, or even a combination of those. Modeling tools supporting Archimate as a dialect can make integration with enterprise architecture tools that are also supporting Archimate a little easier.

    Conclusion

    Being able to address both worlds is an important issue and not an easy task. Common meta models may help, but are not a must. More important is the ability to map high-level enterprise architecture blocks to medium-level system architecture content and that in turn to low-level system design content which can also partly be reverse engineered directly from running systems.

    There are also tools that address both tool styles like ADOIT or upcoming versions of Bpanda that might be helpful, too. Let’s call it hybrid data-diagram style. Again, it is not a must, especially if different tools are already set in the organization and shall be integrated. The options are ranging from built-in integration features like export/import capabilities to separate integration tools like Smartfacts which provides a portal merging data from different tools via OSLC or classic synchronization.

  • Feature Lifecycle in Architecture

    #feature #lifecycle #tracing

    When changing your application landscape on a bigger scale you might have to worry about a target architecture that you can only reach with intermediate steps like per year or release. Even a high-level roadmap may be rather complex due to necessary plan changes. The following reduced example shows the core problem:

    Feature Roadmap

    As you see, applications are repeated in different time windows and so are the features they provide. Moreover, feature provisioning may change like “Duplicate Check” might move from “LegacyCRM” to “BrandnewCMR”. In addition, features themselves may change like “Search Customer” and “Search Partner” being merged into “Search Account”.

    I see people doing these things in Excel and Visio or, even worse, in Powerpoint. And everytime my hair stands up expecting a lot of waste or worse like lost COVID-19 results. Excel is a powerful thing, no doubt, but it has its limits. The right way to do such an exercise is using a proper method with a proper tool set. There are many options like application lifecycle tools, enterprise architecture management tools, and modeling tools. I will explain the core concept using a modeling tool, but it can easily be translated to other tools.

    The core concept is based on adding the notion of lifecycle or time in general to your plan elements. Each gets a begin and end date between which it is valid. Consequently, showing an application being valid from 2018 to 2022 in a plan scenario for 2025 is not valid because it is long gone. But, since applications and also features typically live for many years, we can save a lot of redundancy by reusing the same elements wherever valid which also drastically improves consistency of your plan.

    Now, you can understand much better how we build the diagram from above. In fact, our database contains less elements and relations than you count on the diagram since we simply reuse them where valid.

    Plan Elements

    You may already guess the drastic improvement you can achieve in your very probably much larger scenario. It’s getting even better because we are now able to improve data quality with data validation as well as Powerpoint slides and Excel sheets by simply getting those as results of reports. We can even transfer plan data from and to other tools if necessary like for requirements management or budget planning.

  • Service for You: Architecture Potential Analysis

    #architecture #clarity #velocity #direction 

    I will find out for you, what potential is hidden in your IT – on enterprise level, project level, and system level.

    • Easily see where your processes sluggishly overlap based on consistent as-is tabular and graphical data
    • Gain grip with stronger planning capabilities
    • Drive things forward with clarity, velocity, and direction
    • Replace verbose talking and shiny bubbles with clear facts, a common target, and the ability to deliver

    High quality. Fully independent. Absolutely loyal.

    Fixed price option.

  • Executive Summary: Data Strategy 2.0

    #architecture #clarity #velocity #direction 

    In my last post Executive Summary: Strategic Data Science, I have summarized what Data Science is and what it consist of. Moreover, you need to deploy a strategy that helps you manage transformation to a data-driven business.

    Today, you will see that a strategy for data science can be handled just like any data strategy. And if you already have a data strategy deployed, e.g. as part of your governance or architecture initiative, then you will see why and where it is affected.

    As written in Executive Summary on EA Maturity, having a map knowing where you are and where you want to go to helps a lot in finding a way.

    Maturity

    If you are working with maturity models, you typically do this on a yearly basis. For chosen capabilities you identify current vs target maturity e.g. ranked from level 1 to 5.

    The first thing you need to understand is that introducing data science for the first time reduces your overall maturity at once. Why is that?

    Maturity is measured in terms of capabilities. And if you take a look into those capabilities you will find that you need to adapt them. There typically are a dozen or so like vision, objectives, people, processes, policies, master data management, business intelligence, big data analytics, data quality, data modeling, data asset planning, data integration, and metadata management.

    I will pick only a few as examples to make things clear. Let’s pick vision, people, and technology.

    Selected Capabilities for Explaining Maturity of Data Strategy

    Vision

    Say you have a vision like: “Providing customer care that is so satisfying, that every customer comes back to us with a smile”. That’s a very strong statement, but how about: “Keeping every customer satisfied by solving all problems before complaining”. Wow, even stronger. It is possible because Data Science allows you to predict what others can’t.

    People

    Probably, you already have a data architect. But, the classic data architect focuses on architecture, technology, and governance issues. This is OK, but you also need some data advisor focusing on unseen solutions for the business. Someone telling you to combine customer data with product usage data increasing your sales. And perhaps even telling you from which of your precious data you can create completely new data-driven products you can sell.

    Technology

    Probably, you also have an inventory telling you which data sources are used in your applications. Adding Data Science as rapidly growing discipline to the equation, you may find that you will have to revise your technology portfolio. It is rapidly growing and changing and, therefore, needs to be governed to a certain amount (freedom vs standardization).

    Following list shows selected technologies that are most often used in Data Science (ranked from left to right).

    • Programming Languages: SQL, Python, R
    • Relational Databases: MySQL, MS SQL Server, PostgreSQL
    • Big data platforms: Spark, Hive, MongoDB
    • Spreadsheets, BI, Reporting: Excel, Power BI, QlikView

    Moreover, there is a shift in who is actually using these technologies like Leadership, Finance, Sales, and Marketing. And more often without dedicated enterprise applications because data analysis is very dynamic and has a lot of try and error to it.

    Conclusion

    From these view capabilities out of a dozen+ it has become clear that Data Science Strategy easily fits into an overall Data Strategy. There is no need to reinvent the wheel. Instead, adapt your existing or favorite Data Strategy to incorparate Data Science.